Today, I take a brief departure from covering bullpucky spewed by the 2012 presidential candidates and their running mates to honor a request by C.G. from Washington State about state-level races:
I'd be interested in seeing a breakdown along incumbent versus challenger lines using a larger sample of candidates from state-level races....I suspect a candidate's predisposition for spewing malarky might also be influenced by their challenger status.
Some redditors have made similar requests. Since I'm still reeling from an epic battle with a stomach parasite on Saturday, and my host family is telling me to rest another day before I return to the field (subtext, "...so that you decrease your chances of scaring the crap out of us again by looking like you're about to die"), I did my best to honor these requests.
Unfortunately, there's not a lot of fact checking data out there on state-level races from my two currently approved fact checking sources, PolitiFact.com and The Washington Post's Fact Checker. Furthermore, The Fact Checker doesn't publish easy-to-data-mine report cards for anybody but presidential candidates. So, here's the first limitation of this analysis:
Limitation 1: Only using PolitiFact.com Truth-O-Meter report cards instead of averaging across two fact checkers.
In order to compare incumbents to challengers, I need a non-empty report card for the incumbent and the challenger(s). It appears that PolitiFact.com only has non-empty report cards for Senate races. So...
Limitation 2: Only comparing incumbents to challengers in U.S. Senate races.
It gets worse. PolitiFact has ambitions to be present in every state in the Union, but I could only find sufficient data from the races in four states: Florida, Ohio, Rhode Island, and Tennessee. So...
Limitation 3: Analysis limited to four states: FL, OH, RI, and TN (here is the raw data).
But wait! There's more! There are only 21 U.S. Senate seats up for election in which the incumbent is running, and the incumbent is Democrat or Republican. There is one Independent incumbent, Bernie Sanders (Liberty Union Party from Vermont), running for re-election, but there is insufficient data to include him in the analysis. Of the 21 Democratic or Republican seats in which the incumbent is running, 15 are Democratic and six are Republican. So our measurement of the challenger effect might be confounded by any differences that exist between the factuality of Democrats and Republicans. Thus...
Limitation 4: Estimate of challenger/incumbent differences might be confounded by party-related differences.
Keeping in mind these limitations, let's proceed with the analysis. At the very least, we can compare to a better analysis once more and better data becomes available (if it ever does).
Anyway, I collected the subset of candidates' statements that occurred after the challenger announced his/her candidacy.
Simulation Method
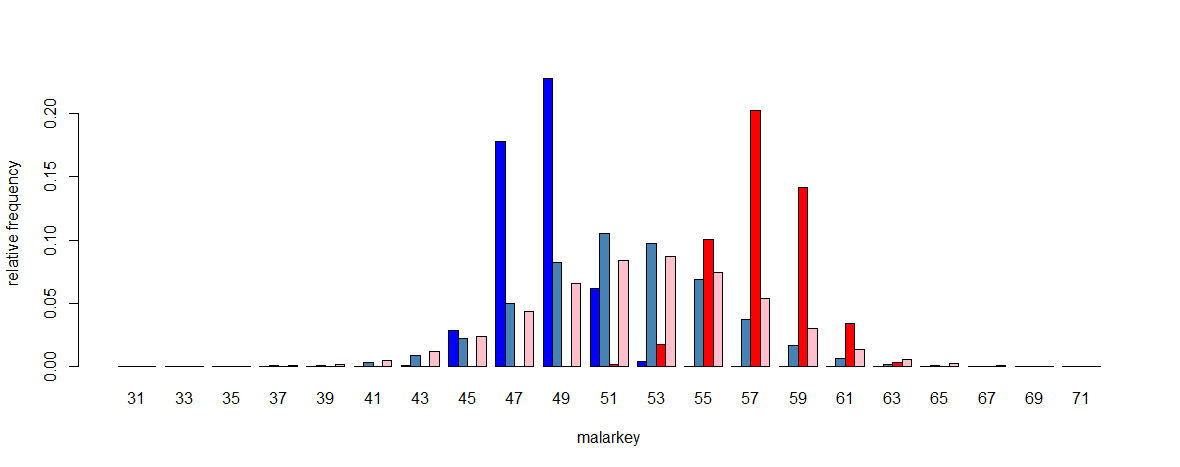
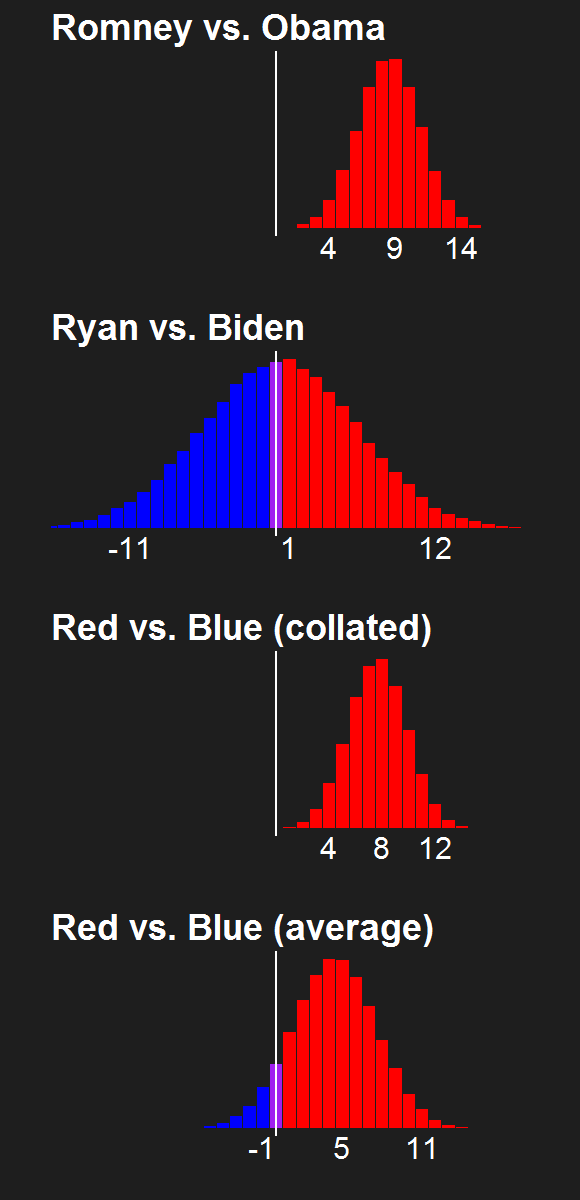
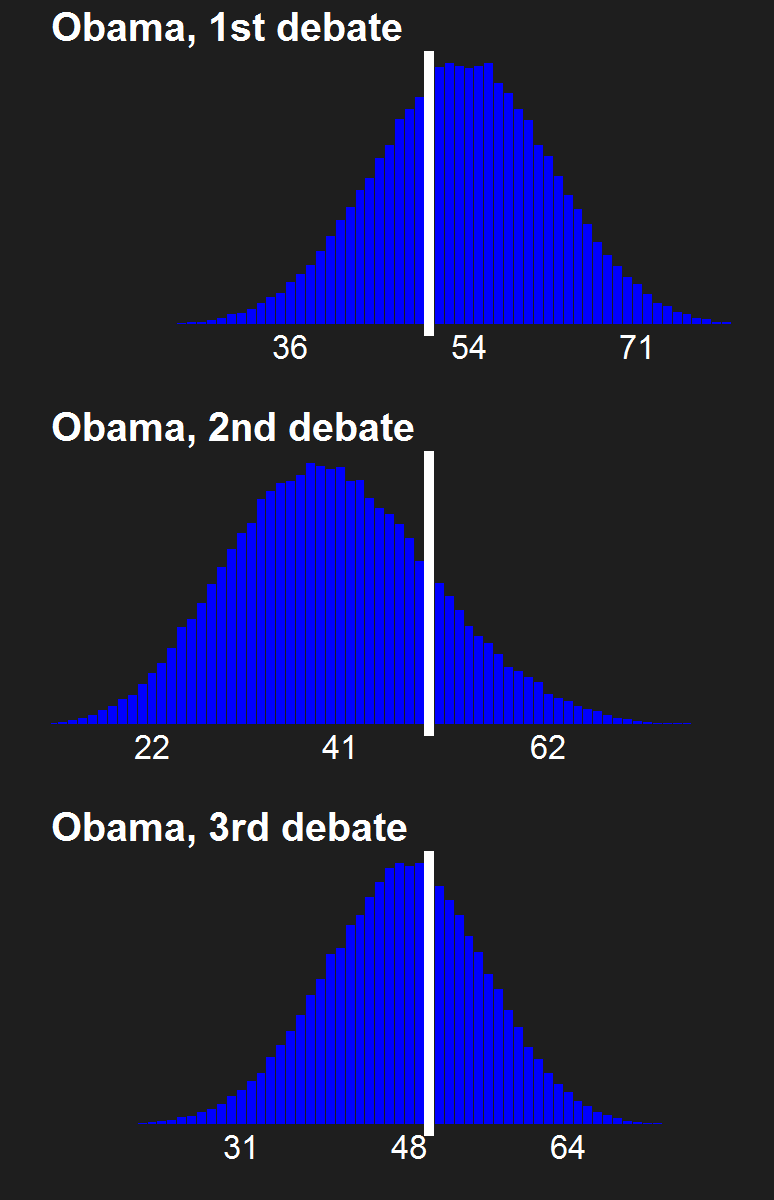
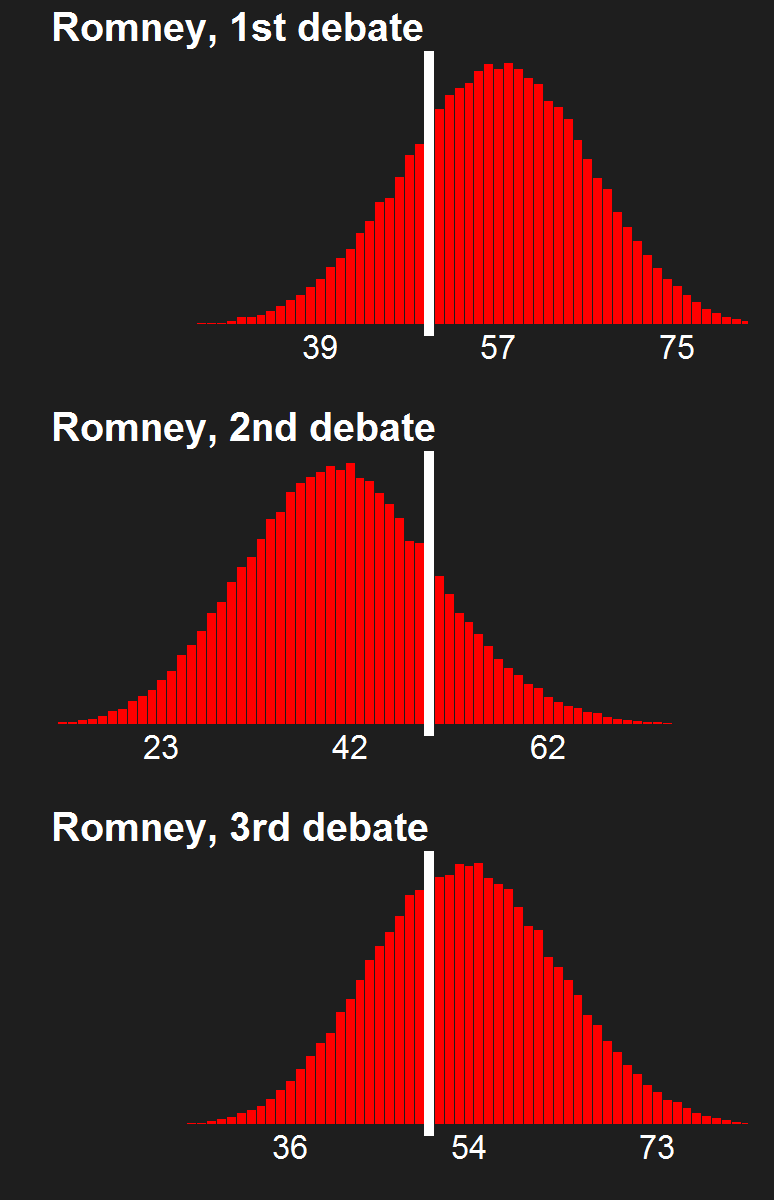
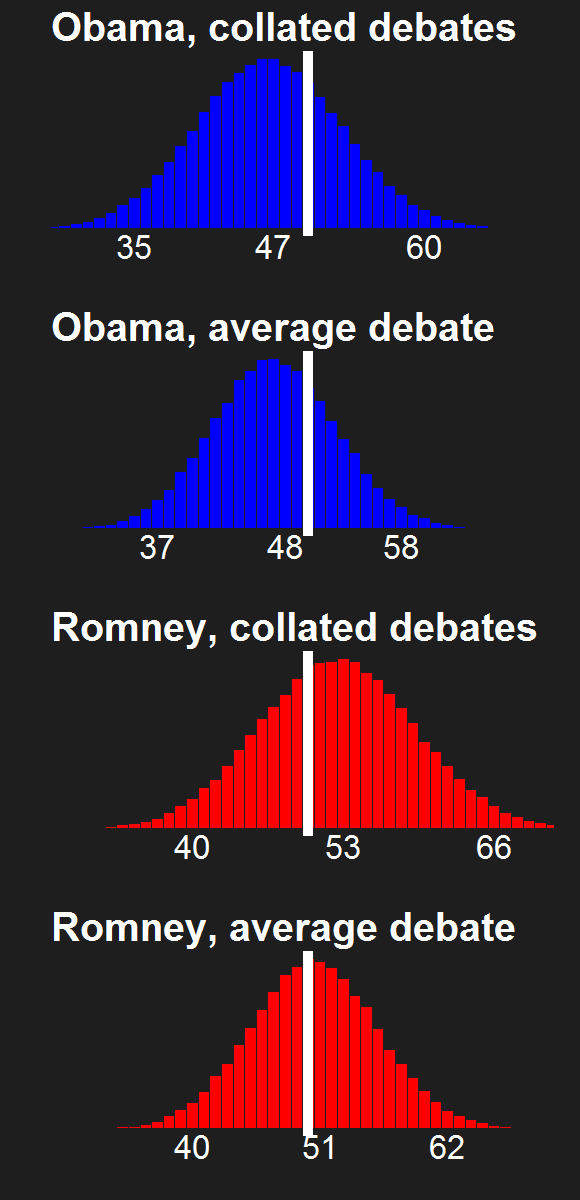
For each individual in the sample, I drew a random report card from the Dirichlet distribution with parameters equal to the counts in each category plus one, and calculated the bullpucky score from that report card. From this collection of simulated bullpucky scores, I calculated two average bullpucky scores, one for incumbents, one for challengers. Then I repeated that whole process 100,000 times. Actually, I used vector and matrix algebraic functions in R to come up with the same result much more efficiently (like almost instantaneously as opposed to several minutes).
Findings
Below is a table showing the mean average bullpucky of incumbents and challengers, along with the lower and upper bounds of the 95% confidence interval.
| Candidate type Challenger Incumbent | lower 45 37 | mean 55 47 | upper 65 57 |
Based on the means of the distributions, it looks like challengers spew more bullpucky than incumbents. Yet their 95% confidence intervals overlap considerably. What is the range of comparisons between challenger and incumbent bullpucky that we can be 95% confident we would obtain if we repeated this experiment many many times?
The average ratio of challenger to incumbent bullpucky that we'd expect from a sample like this turns out to be 1.18, corroborating our suspicion that challengers spew more bullpucky (but not that much more). Yet that figure lies within a 95% confidence interval between 0.88 (which suggests that challengers spew less bullpucky) and 1.57. How certain can we be that challengers spew more bullpucky than incumbents?
Answer: About 86% certain. That is, the odds are about 6 to 1 that challengers spew more bullpucky than incumbents.
At least based on this small, problematic sample.